|
R&D Systems
recombinant her2 rerbb2 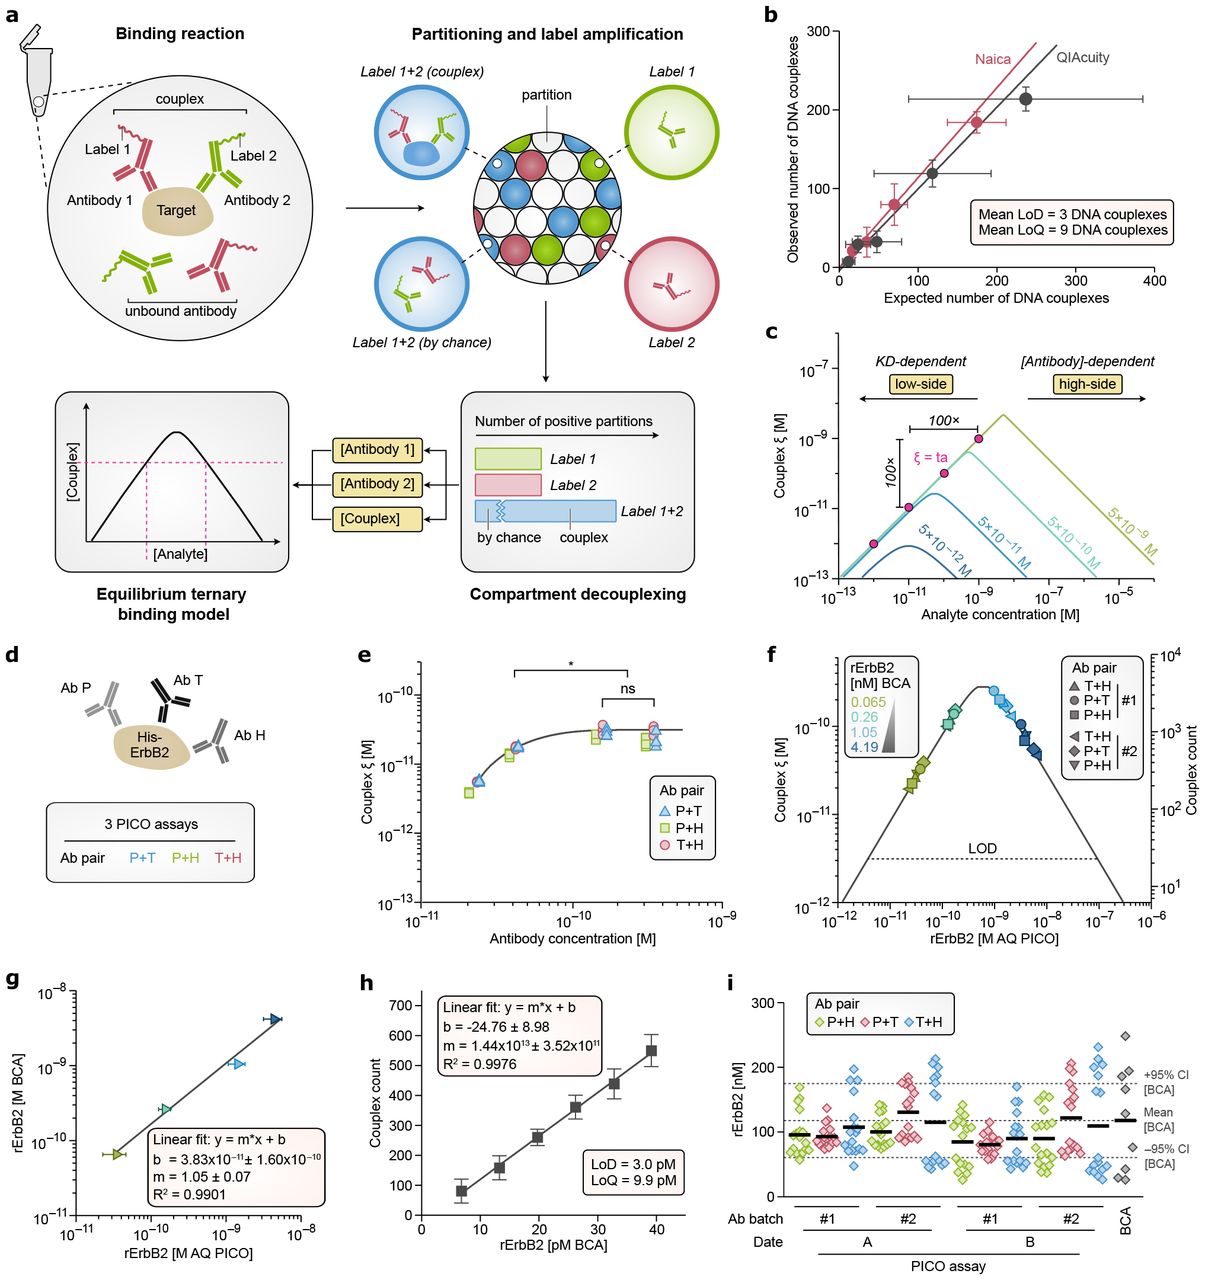 Recombinant Her2 Rerbb2, supplied by R&D Systems, used in various techniques. Bioz Stars score: 94/100, based on 1 PubMed citations. ZERO BIAS - scores, article reviews, protocol conditions and more https://www.bioz.com/result/recombinant her2 rerbb2/product/R&D Systems Average 94 stars, based on 1 article reviews
recombinant her2 rerbb2 - by Bioz Stars,
2026-03
94/100 stars
|
Buy from Supplier |
|
Carna Inc
her2 egfr wt  Her2 Egfr Wt, supplied by Carna Inc, used in various techniques. Bioz Stars score: 95/100, based on 1 PubMed citations. ZERO BIAS - scores, article reviews, protocol conditions and more https://www.bioz.com/result/her2 egfr wt/product/Carna Inc Average 95 stars, based on 1 article reviews
her2 egfr wt - by Bioz Stars,
2026-03
95/100 stars
|
Buy from Supplier |
|
Quantum Dot Inc
quantum dot (qd)-stained erbb2 molecules Quantum Dot (Qd) Stained Erbb2 Molecules, supplied by Quantum Dot Inc, used in various techniques. Bioz Stars score: 90/100, based on 1 PubMed citations. ZERO BIAS - scores, article reviews, protocol conditions and more https://www.bioz.com/result/quantum dot (qd)-stained erbb2 molecules/product/Quantum Dot Inc Average 90 stars, based on 1 article reviews
quantum dot (qd)-stained erbb2 molecules - by Bioz Stars,
2026-03
90/100 stars
|
Buy from Supplier |
|
Affibody
her-2 (affibody)  Her 2 (Affibody), supplied by Affibody, used in various techniques. Bioz Stars score: 90/100, based on 1 PubMed citations. ZERO BIAS - scores, article reviews, protocol conditions and more https://www.bioz.com/result/her-2 (affibody)/product/Affibody Average 90 stars, based on 1 article reviews
her-2 (affibody) - by Bioz Stars,
2026-03
90/100 stars
|
Buy from Supplier |
|
OriGene
wild type erbb2 Wild Type Erbb2, supplied by OriGene, used in various techniques. Bioz Stars score: 90/100, based on 1 PubMed citations. ZERO BIAS - scores, article reviews, protocol conditions and more https://www.bioz.com/result/wild type erbb2/product/OriGene Average 90 stars, based on 1 article reviews
wild type erbb2 - by Bioz Stars,
2026-03
90/100 stars
|
Buy from Supplier |
|
Affibody
histidine-tagged her-2-specific affibody (his6-z her2:342- cys) Histidine Tagged Her 2 Specific Affibody (His6 Z Her2:342 Cys), supplied by Affibody, used in various techniques. Bioz Stars score: 90/100, based on 1 PubMed citations. ZERO BIAS - scores, article reviews, protocol conditions and more https://www.bioz.com/result/histidine-tagged her-2-specific affibody (his6-z her2:342- cys)/product/Affibody Average 90 stars, based on 1 article reviews
histidine-tagged her-2-specific affibody (his6-z her2:342- cys) - by Bioz Stars,
2026-03
90/100 stars
|
Buy from Supplier |
|
Millipore
antibodies against her-2 Antibodies Against Her 2, supplied by Millipore, used in various techniques. Bioz Stars score: 90/100, based on 1 PubMed citations. ZERO BIAS - scores, article reviews, protocol conditions and more https://www.bioz.com/result/antibodies against her-2/product/Millipore Average 90 stars, based on 1 article reviews
antibodies against her-2 - by Bioz Stars,
2026-03
90/100 stars
|
Buy from Supplier |
|
Agilent technologies
her2/cep-17 iqish probe mix Her2/Cep 17 Iqish Probe Mix, supplied by Agilent technologies, used in various techniques. Bioz Stars score: 90/100, based on 1 PubMed citations. ZERO BIAS - scores, article reviews, protocol conditions and more https://www.bioz.com/result/her2/cep-17 iqish probe mix/product/Agilent technologies Average 90 stars, based on 1 article reviews
her2/cep-17 iqish probe mix - by Bioz Stars,
2026-03
90/100 stars
|
Buy from Supplier |
|
Diagnostic BioSystems
monoclonal rabbit antibody to her-2 receptor Monoclonal Rabbit Antibody To Her 2 Receptor, supplied by Diagnostic BioSystems, used in various techniques. Bioz Stars score: 90/100, based on 1 PubMed citations. ZERO BIAS - scores, article reviews, protocol conditions and more https://www.bioz.com/result/monoclonal rabbit antibody to her-2 receptor/product/Diagnostic BioSystems Average 90 stars, based on 1 article reviews
monoclonal rabbit antibody to her-2 receptor - by Bioz Stars,
2026-03
90/100 stars
|
Buy from Supplier |
|
Abcam
hs fe peg her 2  Hs Fe Peg Her 2, supplied by Abcam, used in various techniques. Bioz Stars score: 95/100, based on 1 PubMed citations. ZERO BIAS - scores, article reviews, protocol conditions and more https://www.bioz.com/result/hs fe peg her 2/product/Abcam Average 95 stars, based on 1 article reviews
hs fe peg her 2 - by Bioz Stars,
2026-03
95/100 stars
|
Buy from Supplier |
|
OriGene
rc212583l1v Rc212583l1v, supplied by OriGene, used in various techniques. Bioz Stars score: 91/100, based on 1 PubMed citations. ZERO BIAS - scores, article reviews, protocol conditions and more https://www.bioz.com/result/rc212583l1v/product/OriGene Average 91 stars, based on 1 article reviews
rc212583l1v - by Bioz Stars,
2026-03
91/100 stars
|
Buy from Supplier |
|
Agilent technologies
anti-her-2 antibodies c-erb2, a0485 Anti Her 2 Antibodies C Erb2, A0485, supplied by Agilent technologies, used in various techniques. Bioz Stars score: 90/100, based on 1 PubMed citations. ZERO BIAS - scores, article reviews, protocol conditions and more https://www.bioz.com/result/anti-her-2 antibodies c-erb2, a0485/product/Agilent technologies Average 90 stars, based on 1 article reviews
anti-her-2 antibodies c-erb2, a0485 - by Bioz Stars,
2026-03
90/100 stars
|
Buy from Supplier |
Image Search Results
Journal: bioRxiv
Article Title: Lossless Single-Molecule Counting To Absolute Quantify Proteoforms
doi: 10.1101/2024.03.19.585761
Figure Lengend Snippet: a . The schematic workflow for absolute quantification. The PICO binding reaction described by the AQ model (Appendix B), and consists of the analyte and two amplifiable DNA label-conjugated antibodies under appropriate binding concentrations and conditions (D.5). After incubation the reaction is subsequently diluted according to the conditions required for a single-molecule digital PCR (dPCR)D.4. To provide inputs for the AQ model, the concentrations of couplexes and antibodies required are determined using the decouplexing model (Section A), ultimately yielding the absolute concentration of analyte. Additionally, the labeling efficiency is considered for antibody concentration correction (Section D.3). b . Analytical PICO. Spiked-in versus observed number of artificial DNA couplexes applying the decouplexing model. The experimental details are in Method and Reagents D.6. The experiments were repeated on different devices as indicated. R 2 is larger than 0.99 in all cases, the slopes are 1.04 ± 0.39 for Qiacuity and 1.14 ± 0.15 for Stilla, respectively, indicating 1-to-1 correspondence between spiked-in and measured amounts, showing lossless single-molecule counting. The average Y-intercept is − 2.28 ± 10.21 couplex, indicating zero background. The mean analytical LOD of analytical PICO is 3 couplexes and the LOQ is 9 couplexes, based on the devised calculations of Wenzl et al. . c . The non-bijective calibration curve of the AQ model relates absolute analyte concentration (x-axis) to measured couplex molar concentration ( ξ , y-axis) in the binding reaction. It demonstrates the influence of decreasing antibody concentrations. Under saturated conditions, the three highest antibody concentrations, the K d -dependence of ξ is eliminated, as the ξ matches the target analyte concentration on the low side, while on the high side, the analyte concentration is calculated from the antibody concentrations using the AQ model. See AQ model in Section B for more details. d . Proof of absolute quantification. BCA verified amount of recombinant ErbB2, as quantitative external reference, was assayed in a triangular PICO setup using trastuzumab (T), pertuzumab (P) and anti-HiS (H) antibodies (see Materials and Methods D.1 and D.5). In the triangular PICO concept, the three antibodies forming three ABPs, which quantitative, pair-wise PICO AQ results must equal (internal verification) if absolute quantitativity holds. e . An isomolar (antigen) titration (D.5) was conducted at various concentrations of antibodies (13.3 pM, 40.0 pM, 120 pM, and 360 pM) with a fixed rErbB2 concentration of 40 pM. At the higher antibody concentrations, the generated number of couplexes did not significantly differ (Kruskal-Wallis ANOVA with Tukey’s test, p < 0.05), indicating that a saturation concentration of the standard ABX = 500 pM suffices for all antibodies. f . AQ (calibration) curve of recombinant ErbB2 (BCA verified). Symbols indicate different ABPs. The verified mean concentration of (all three) antibodies from the first batch is 5.29 × 10 − 10 ± 9.16 × 10 − 11 M (n=138) and for the second batch 5.66 × 10 − 10 ± 6.04 × 10 − 11 M (n=138), saturating concentration. The assay carried out using two different batches of antibodies (#1 and #2), each marker representing the mean of 6 replicates and with standard deviations are shown (mainly imperceptible), n=216. The dotted line denotes the LOD of measurement (20 couplexes, LOD 3.00 pM). g . BCA reference vs. AQ PICO (data from see also c.). A regression line has a slope of 1.05 ± 0.07, intercept 38.3 ± 160 pM and R 2 = 0.99 with n = 216, confirms the linearity of the AQ model involving both sides of the curve. h . The relationship between the measured number of couplexes and the reference (BCA) values for the rErbB2 analyte, within close vicinity of the limit of detection (LOD), at 6.75 pM, 13.3 pM, 19.7 pM, 26.2 pM, 32.8 pM and 39.1 pM of rErbB2, respectively. LOD was 3.00 pM and LOQ 9.90 pM. Slope m = 14.4 ± 0.35, y-axis intersection b = − 24.76 ± 8.98, R 2 = 0.99, n = 36. i . Distribution of the measured absolute amounts of the rErbB2 quantitative reference normalised for dilution (see also c.). Two different time point, two different batches of antibodies, three ABPs and four dilution of of the analyte. The BCA quantified reference indicated (118 ± 87.7 nM) with 95% confidence intervals. Values from left to right are 95.44 ± 33.70 nM, 92.87 ± 16.60 nM, 107.28 ± 45.59 nM, 99.99 ± 23.62 nM, 130.52 ± 38.18 nM, 115.09 ± 69.39 nM, 84.65 ± 39.45 nM, 80.41 ± 15.41 nM, 89.77 ± 40.57 nM, 89.77 ± 40.57 nM, 121.64 ± 52.19 nM and 109.23 ± 79.41 nM stock concentration, respectively. ANOVA shows no significant differences observed in terms of ABPs, assay dates, and PICO compared to BCA (F(12,202) = 1.77, p-value = 0.0553, n = 211). These findings substantiate the absolute quantitative measurement of recombinant ErbB2, demonstrating lossless molecular counting, negligible background, and pronounced linearity over 3.5 log dynamic range.
Article Snippet:
Techniques: Quantitative Proteomics, Binding Assay, Incubation, Digital PCR, Concentration Assay, Labeling, Single Molecule Counting, Recombinant, Titration, Generated, Marker
![Comparing high sensitivity measurements using SIMOA and PICO. a . The quantification of rErbB2 using the SIMOA. Antibodies are trastuzumab (T) and pertuzumab (P) as capture and detection antibodies (varied), respectively. Measurements were 3000 pg/ml, 1000 pg/ml, 333 pg/ml, 111 pg/ml, 37 pg/ml, 12.3 pg/ml and 4.12 pg/ml. The legend table shows the linear regression and the limit of detection (LOD). b . The table shows the comparison of PICO and SIMOA assays. Conditions are indicated, λ , the measured LOD (M) and LOD (# molecules). The red font indicates extrapolated data. SIMOA demonstrates superior sensitivity at lower or comparable compartment size. However, considering sample volume, at the same compartment size, SIMOA and PICO exhibit similar sensitivities. Notably, PICO employs a high dilution before the dPCR detection step, which is reflected the vastly different LOD [molecules] ( 20,000 times lower for PICO). c .Relationship between LOD and precision of AQ concentrations of PICO as function of partitions size (hyperwelling). Concentrations of ERbB2 were 12.90 pM, 6.43 pM, 3.21 pM, 1.61 pM, and 0.80 pM, ABX is 500 pM, Qiacuity 26K nanoplates were used with 1, 2, 4, or 8 wells hyperwelled, respectively. d . Boxplot represents the mean and distribution of AQ values (ANOVA F(3, 202) = 0.532, p-value = 0.661, n = 205), indicating decreasing %SD over increasing compartment sizes. e . Plot represents the decreasing concentration of LOD over increasing compartment sizes (log-log), showing a linear correlation between number of partition and LOD. f . The table presents values of limit of detection (LOD), LOD [molecule].](https://bio-rxiv-images-cdn.bioz.com/dois_ending_with_61/10__1101_slash_2024__03__19__585761/10__1101_slash_2024__03__19__585761___F11.large.jpg)
Journal: bioRxiv
Article Title: Lossless Single-Molecule Counting To Absolute Quantify Proteoforms
doi: 10.1101/2024.03.19.585761
Figure Lengend Snippet: Comparing high sensitivity measurements using SIMOA and PICO. a . The quantification of rErbB2 using the SIMOA. Antibodies are trastuzumab (T) and pertuzumab (P) as capture and detection antibodies (varied), respectively. Measurements were 3000 pg/ml, 1000 pg/ml, 333 pg/ml, 111 pg/ml, 37 pg/ml, 12.3 pg/ml and 4.12 pg/ml. The legend table shows the linear regression and the limit of detection (LOD). b . The table shows the comparison of PICO and SIMOA assays. Conditions are indicated, λ , the measured LOD (M) and LOD (# molecules). The red font indicates extrapolated data. SIMOA demonstrates superior sensitivity at lower or comparable compartment size. However, considering sample volume, at the same compartment size, SIMOA and PICO exhibit similar sensitivities. Notably, PICO employs a high dilution before the dPCR detection step, which is reflected the vastly different LOD [molecules] ( 20,000 times lower for PICO). c .Relationship between LOD and precision of AQ concentrations of PICO as function of partitions size (hyperwelling). Concentrations of ERbB2 were 12.90 pM, 6.43 pM, 3.21 pM, 1.61 pM, and 0.80 pM, ABX is 500 pM, Qiacuity 26K nanoplates were used with 1, 2, 4, or 8 wells hyperwelled, respectively. d . Boxplot represents the mean and distribution of AQ values (ANOVA F(3, 202) = 0.532, p-value = 0.661, n = 205), indicating decreasing %SD over increasing compartment sizes. e . Plot represents the decreasing concentration of LOD over increasing compartment sizes (log-log), showing a linear correlation between number of partition and LOD. f . The table presents values of limit of detection (LOD), LOD [molecule].
Article Snippet:
Techniques: Comparison, Concentration Assay

Journal: bioRxiv
Article Title: Lossless Single-Molecule Counting To Absolute Quantify Proteoforms
doi: 10.1101/2024.03.19.585761
Figure Lengend Snippet: a . Western blotting involved loading varying cell quantities of BT474 and MCF7 cells as indicated, followed by immunodetection using trastuzumab (anti-ErbB2) and anti-GAPDH antibodies as loading control (detailed in Material and Methods, Section D.7). For BT474 (ErbB2 over-expressing breast cancer cellline) the ErbB2 signal diminished to an undetectable level at approximately 40,000 cells per lane. Notably, ErbB2 expression in MCF7 cells was scarcely detectable even at 300,000 cells, while the loading controls are comparable. BT474 cells express 1,940,000 ERbB2 proteins per cell (qFACS) , while MCF7 exhibits approximately 100-fold lower expression (Western) . Considering a limit of detection (LOD) at 40,000 cells for BT474, MCF7 falls below the LOD of Western at 300,000 cells. b . ERbB2 triangular PICO assay with bystander antibody. See also , note that Ab H was used here as a bystander antibody - BAB, as an internal negative control, as natural ErbB2 has no HiS-tag. c . Absolute number of couplexes measured of ErbB2 PICO using different number of lysed BT474 and MCF7 cells (each 6 parallels), as indicated, and ABPs, all assayed at λ = 0.15, as described in Material and Methods (D.5). ABC (antibody binding control) is used as an analyte-free negative control, and expected to be zero. Data is normally distributed (Shapiro-Wilk, p > 0.1, n = 144), the cell measurements of P+T ABP are all significantly different from zero (t-test, p < 0.001, n = 36), while BAB pairs are not significantly different from zero (t-test, p > 0.1, n = 108), means are indicated. The bystander antibody (BAB) measuring unspecific binding, the consistently zero BAB signals confirm zero background. d . AQ curves of BT474 and MCF7 of ErbB2 PICO based on Fig.c data. The Y-axis represents the concentration of couplexes, and the X-axis denotes the absolute molar concentration of the analyte in the binding reaction. The mean concentration of the antibodies of T and P for the BT474 assay is 3.61 × 10 − 10 ± 4.46 × 10 − 11 M (n=46) and for the MCF7 3.25 × 10 − 10 ± 3.56 × 10 − 11 M (n=40), saturating conditions. The calculated absolute concentrations effectively replicate the cell dilution series (data not shown), and yielding estimates of 8.88 × 10 5 ± 1.50 × 10 5 ErbB2 per cell for BT474 and 9.86 × 10 3 ± 3.19 × 10 3 ErbB2 per cell for MCF7, corresponding a 90.1 × of relative expression difference, confirming previous findings . The slight departure of BT474 expression form qFACS data ( ∼ 0.45 × ) is explained by biological variability or reproducibility problems (for qFACS ), also PICO is highly consistent between experiments, and with ELISA, see also . e . Absolute concentration vs. cell number of data Fig.c. The LOD calculation was conducted according to Wenzl et al.,and a LOD of 17.31 ± 15.96 BT474 cells and 982.53 ± 856.29 MCF7 cells were determined, respectively. Similarly, LOQs were 75.14 ± 52.6 BT474 cells and 4264.18 ± 2825.76 MCF7 cells. f . The reproducibility of PICO. ErbB2 proteins of BT474 and MCF7 cells were measured with PICO, including varied of ABPs and operators and verified against ELISA. The double Y-axis represent ErbB2 concentrations (in the binding reaction) and proteins per cell. Log2 fold differences were calculated as (sample mean) / (group mean), and also indicated. All (PICO) average copy numbers per cell of ErbB2 were 1.02 × 10 6 (±2.10 × 10 5 ), and 1.06 × 10 4 (±2.96 × 10 3 ) ( n = 178), for BT474 and MCF7, respectively. BT474 cells expressed approximately 96.52 (±25.32) times more ErbB2 than MCF7 cells, a significant difference (F(9,220)=941.64, p-value<0.0001, n=229). ANOVA revealed no statistical difference between MCF7 samples (F(4, 135)=1.86, p-value = 0.121, n=139), while BT474 cells exhibited significant differences (F(4,85)=53.03, p-value < 0.0001, n=89), albeit with minimal deviation ( CV = 20.56%) and low fold differences, attributable to biological variations. ELISA measured an ErbB2 expression per cell 6.49 × 10 5 ± 8.34 × 10 4 , 0.69 times less than average PICO data, p = 0.0026, n = 66, and 9.45 × 10 3 ± 1.57 × 10 3 , 1.06 times less then PICO, p = 0.19, n = 118, for BT474 and MCF7, respectively. The individual molar ErbB2 of each group from left to right are 10.8 (±1.38) nM, 20.4 (±2.29) nM, 13.0 (±1.01) nM, 17.1 (±2.37) nM, 14.7 (±2.25) nM, 157 (±26.0) pM, 194 (±56.3) pM, 157 (±21.5) pM, 169 (±40.3) pM, 164 (±52.9) pM. Altogether PICO showed high precision and reproducibility, especially for MCF7 cells, BT474 has higher ErbB2 expression per cell and consequently more effected with sampling errors of cell counting. g . The specificity of PICO. An absolute quantitative spike-in experiment was carried using two dilutions of MCF7 cells (10,000 and 40,000 cells, representing the theoretical concentrations of 39.3, and 157.5 pM, respectively) and rErbB2 protein (60 and 20 pM). Samples were as indicated ( n = 4), and were compared to bootstrapped values. ANOVA were applied to compare bootstrapped combinations of MCF7 and rErbB2 concentrations demonstrating no significant differences ( p < 0.05) in all comparisons. The spike-in experiment demonstrates robust specificity, allowing unbiased measurement of rErbB2 levels in the presence of endogenous ErbB2 and lysed cell material, maintaining concentration additivity.
Article Snippet:
Techniques: Western Blot, Immunodetection, Control, Expressing, Negative Control, Binding Assay, Concentration Assay, Enzyme-linked Immunosorbent Assay, Sampling, Cell Counting

Journal: bioRxiv
Article Title: Lossless Single-Molecule Counting To Absolute Quantify Proteoforms
doi: 10.1101/2024.03.19.585761
Figure Lengend Snippet: Purification of rTRX D.1. SDS-PAGE of Ni-NTA (a) and STREP-Tactin (b) fractions. a . lanes are left to rigth E. coli pellet, the lysed sample (load), flow-through (FT), wash (W1 – W2) and fractioned eluates (E1-E5), while b . pooled Ni-NTA elutes as load, flow-through (FT), wash (W1 – W2) and fractioned eluates (E1-E6) c . The purity of rTRX compared to BSA. d . SEC-MALS results of the rTRX and rErbB2, depicted elution volume vs molar mass (overlay of rTRX and rErbB2). The molecular weights of rTRX was 20.8 kDa and for rErbB2 82.6 kDa were determined, rErbB2 contains 3.8% (m/m) of higher MW impurity, unlikely being ErbB2 aggregates, ErbB2 is considered to be pure with molarity corrected for the impurity, while rTRX partially forms dimers, where the 52% of mass is in dimer form, and it is assumed that it reduces the m/v concentration based dPCR countable molarity of rTRX by 34.2%, which compensated in the final AQ PICO results. Absolute quantification of recombinant thioredoxin. e . Schematic representation of the triangular PICO assay. The BCA quantified rTRX was reacted with anti-penta-his (H), anti-thioredoxin (T), and anti-strep-tag-II (S) antibodies, respectively see D.1. f . isomolar titration, determination of the saturation concentration of the antibodies. Concetration of antibodies were from left to right of 25 pM, 75 pM, 220 pM, 660 pM and 2 nM, respectively - and PICO binding reactions were set up using of a constant, (isomolar) concentration of rTRX of 200 pM (see D.5). The molar concentration of the formed couplexes ( ξ ) was determined and showed saturation by the increasing ABX concentration. The minimal saturating concentration was determined by ANOVA (Kruskal-Wallis ANOVA with Tukey’s test, *p < 0.05, n=90) being less than 500pM. Different markers indicate the different ABPs (see legend). g . AQ (calibration) curve of recombinant rTRX. Symbols indicate different ABPs, the assay carried out using two different batches of antibodies (#1 and #2) at 500 pM of ABX (antibody mix), each marker representing the mean of 8 replicates and with standard deviations are shown (mainly imperceptible), n=144. The dotted line denotes the LOD of measurement (20 couplexes, LOD 3.9 pM). The average AQ values for each dilution of the sample (n=48) accurately reproducing the reference concentrations measured with BCA (t-test indicated) in order from blue to green, 8.38 ± 5.45 nM BCA to 9.91 ± 2.77 nM PICO (p = 0.43), 1.68 ± 1.09 nM BCA to 3.35 ± 4.97 nM PICO (p = 0.0016), 335 ± 218 pM BCA to 196 ± 91.0 pM PICO (p = 0.09), 67 ± 43.5 pM BCA to 78.3 ± 29.6 pM PICO (p = 0.47), and 13.4 ± 8.72 pM BCA to 11 ± 6.23 pM PICO (0.45). h . Correlation of PICO AQ values against the BCA reference. The regression line has a slope of 1.07 ± 0.11, intercept 290 ± 440 pM and R 2 = 0.99 with n = 234, confirms 1-1 lossless counting. i . Correlation AQ plot of couplexes and the BCA reference measuring rTRX, within close vicinity of the limit of detection (LOD). LOD was 3.94 pM and LOQ 13.02 pM, slope m = 1.42 × 10 13 ± 2.03 × 10 11 , y-axis intersection b = -142.44 ± 13.67, R2 = 0.99, n=42. rTRX concentrations are 100 pM, 87.5 pM, 75 pM, 62.5 pM, 50.0 pM, 37.5 pM, 25.0 pM, 12.5 pM and 1 pM. j . The AQ of rTRX measurements combining all dilutions per ABPs each replicated under inter-assay conditions (two operators), and two different dilution series (DS4 and DS5, 4x and 5x dilution series) referenced against BCA measurements (8.38x10⁻⁹ ± 5.45x10⁻⁹ M BCA, n = 9 to 7.82x10⁻⁹ ± 3.70x10⁻⁹ M PICO, n = 363, t.test (t(8)=-0.307, p = 0.766)), the 95% confidence intervals of the BCA measurement indicated as dotted lines. ANOVA shows no significant differences between all groups (F(7, 278) = 0.669 p = 0.698, n=285).
Article Snippet:
Techniques: Purification, SDS Page, Concentration Assay, Quantitative Proteomics, Recombinant, Strep-tag, Titration, Binding Assay, Marker, Inter Assay
Journal: Cancer Science
Article Title: TAS2940 , a novel brain‐penetrable pan‐ERBB inhibitor, for tumors with HER2 and EGFR aberrations
doi: 10.1111/cas.15617
Figure Lengend Snippet: TAS2940 is a covalent human epidermal growth factor receptor type 2 (HER2)/epidermal growth factor receptor (EGFR) inhibitor containing HER2/EGFR exon 20 insertions. (A) Chemical structure of TAS2940. (B) Liquid chromatography‐mass spectrometry analysis of the recombinant human HER2 cytoplasmic domain (HER2 cyt ). (C) MS E spectrum confirmation for protease‐digested recombinant human HER2 peptide (LLGICLTSTVQLVTQLMPYGCLLDHVR) with TAS2940. (D) Kinase inhibitory activity of TAS2940 and approved or investigational HER2/EGFR inhibitors on HER2. (E) Kinase inhibitory activity of TAS2940 and approved or investigational HER2/EGFR inhibitors on EGFR. The mean ± SD of the IC 50 value of each compound was calculated from three independent experiments. (F) Kinome inhibition plot of TAS2940 (left) and poziotinib (right).
Article Snippet: The kinase assays using the ERBB inhibitors were outsourced to SignalChem Lifesciences Corporation for HER2 mutations or
Techniques: Liquid Chromatography, Mass Spectrometry, Recombinant, Activity Assay, Inhibition

Journal: Cancer Science
Article Title: TAS2940 , a novel brain‐penetrable pan‐ERBB inhibitor, for tumors with HER2 and EGFR aberrations
doi: 10.1111/cas.15617
Figure Lengend Snippet: TAS2940 shows higher selectivity for human epidermal growth factor receptor type 2 (HER2) and epidermal growth factor receptor (EGFR) aberrations. (A) The inhibitory effect of TAS2940 on the phosphorylation of HER2/EGFR in MCF10A cells stably expressing WT or mutant HER2/EGFR. The cells were cultured with TAS2940 or poziotinib and harvested for 4 h following treatment. Phosphorylation of HER2‐Tyr1196 and EGFR‐Tyr1068 was determined by the In‐Cell Western assay. (B) Inhibition of the HER2 signaling pathway and effect of TAS2940, lapatinib, tucatinib, or poziotinib in the SK‐BR‐3 cell line. The cell line was treated by each compound for 3 or 48 h. Phosphorylated HER2, HER3, their downstream signaling factors, or apoptosis markers were detected by western blot analysis. BIM, B‐cell lymphoma 2 interacting mediator of cell death; PARP, poly (ADP‐ribose) polymerase.
Article Snippet: The kinase assays using the ERBB inhibitors were outsourced to SignalChem Lifesciences Corporation for HER2 mutations or
Techniques: Stable Transfection, Expressing, Mutagenesis, Cell Culture, In-Cell ELISA, Inhibition, Western Blot

Journal: Cancer Science
Article Title: TAS2940 , a novel brain‐penetrable pan‐ERBB inhibitor, for tumors with HER2 and EGFR aberrations
doi: 10.1111/cas.15617
Figure Lengend Snippet: Inhibitory concentration 50% (IC 50 ) values of compounds for phosphorylation of WT or mutated human epidermal growth factor receptor type 2 (HER2)/epidermal growth factor receptor (EGFR).
Article Snippet: The kinase assays using the ERBB inhibitors were outsourced to SignalChem Lifesciences Corporation for HER2 mutations or
Techniques: Concentration Assay

Journal: Cancer Science
Article Title: TAS2940 , a novel brain‐penetrable pan‐ERBB inhibitor, for tumors with HER2 and EGFR aberrations
doi: 10.1111/cas.15617
Figure Lengend Snippet: Fifty percent growth inhibitory concentration (GI 50 ) values of TAS2940 and other human epidermal growth factor receptor type 2 (HER2)/epidermal growth factor receptor (EGFR) inhibitors for a panel of human cell lines with ERBB1/2 amplification or mutations.
Article Snippet: The kinase assays using the ERBB inhibitors were outsourced to SignalChem Lifesciences Corporation for HER2 mutations or
Techniques: Concentration Assay, Amplification, Mutagenesis

Journal: Cancer Science
Article Title: TAS2940 , a novel brain‐penetrable pan‐ERBB inhibitor, for tumors with HER2 and EGFR aberrations
doi: 10.1111/cas.15617
Figure Lengend Snippet: Pharmacokinetics and pharmacodynamics of TAS2940 in NCI‐N87 mouse xenograft model. (A) Plasma concentration profiles of TAS2940 after a single oral treatment (left panel) or multiple oral treatments for 7 days (right panel) in male BALB/cAJcl‐nu/nu mice. Data are shown as the mean + SD ( n = 3). (B–D) Inhibition of phospho‐human epidermal growth factor receptor type 2 (HER2), HER3, and their downstream molecules by TAS2940 was evaluated in NCI‐N87 nude mouse xenograft model by western blot analysis. Using the samples collected at 1 h following treatment with TAS2940 at various concentrations, the chemiluminescence signal bands for phospho‐HER2, HER2 protein, phospho‐HER3, HER3 protein, and β‐actin in (C) were subjected to semiquantitative analysis, and the phospho‐HER2/HER2 and phospho‐HER3/HER3 signal ratios were calculated (B). Duration of inhibitory activity against HER2 signaling was confirmed after treatment with TAS2940 at 25.0 mg/kg (D).
Article Snippet: The kinase assays using the ERBB inhibitors were outsourced to SignalChem Lifesciences Corporation for HER2 mutations or
Techniques: Concentration Assay, Inhibition, Western Blot, Activity Assay

Journal: Cancer Science
Article Title: TAS2940 , a novel brain‐penetrable pan‐ERBB inhibitor, for tumors with HER2 and EGFR aberrations
doi: 10.1111/cas.15617
Figure Lengend Snippet: Antitumor activity of TAS2940 in multiple mouse xenograft models harboring several human epidermal growth factor receptor type 2 ( HER2 )/ epidermal growth factor receptor ( EGFR ) aberrations. TAS2940, poziotinib, or vehicle was given orally once daily for 14 days in subcutaneous xenograft models bearing (A) NCI‐N87, (B) MCF10A_HER2/insYVMA_v, or (C) NSCLC NCI‐H1975 EGFR D770_N771insSVD. (D) TAS2940, afatinib, osimertinib, or vehicle was given orally once daily for 11 days in subcutaneous xenograft models bearing glioblastoma PDX35. Data are shown as the mean ± SE ( n = 6 in A–C; n = 5 in D).
Article Snippet: The kinase assays using the ERBB inhibitors were outsourced to SignalChem Lifesciences Corporation for HER2 mutations or
Techniques: Activity Assay
![Brain penetrability and antitumor activity of TAS2940 in NCI‐N87‐luc ( human epidermal growth factor receptor type 2 [ HER2 ] amp) and NCI‐H1975_EGFR ex20insSVD‐luc intracranial brain metastasis models. (A) The unbound concentration in the brain to the unbound concentration in plasma ratio ( K p,uu,brain ) values of lapatinib, neratinib, tucatinib, poziotinib, TAS2940, and osimertinib ( n = 3). (B) Total flux (p/s) values in the NCI‐N87‐luc intracranial model. (C) Bioluminescence images obtained on day 22. (D) Total flux (p/s) values in the NCI‐N87‐luc intracranial model with different dosing schedules of TAS2940. (E) Target inhibition of TAS2940 assessed by phospho‐HER2 and growth fraction assessed by Ki‐67 in the NCI‐N87‐luc model. (F) Antitumor activity and survival benefit of TAS2940 in the NCI‐H1975_EGFR ex20ins SVD‐luc intracranial nude mouse model. Data are presented as the mean ± SE ( n = 8 in B,C; n = 6 in D). EGFR, human epidermal growth factor receptor.](https://pub-med-central-images-cdn.bioz.com/pub_med_central_ids_ending_with_9605/pmc09899605/pmc09899605__CAS-114-654-g002.jpg)
Journal: Cancer Science
Article Title: TAS2940 , a novel brain‐penetrable pan‐ERBB inhibitor, for tumors with HER2 and EGFR aberrations
doi: 10.1111/cas.15617
Figure Lengend Snippet: Brain penetrability and antitumor activity of TAS2940 in NCI‐N87‐luc ( human epidermal growth factor receptor type 2 [ HER2 ] amp) and NCI‐H1975_EGFR ex20insSVD‐luc intracranial brain metastasis models. (A) The unbound concentration in the brain to the unbound concentration in plasma ratio ( K p,uu,brain ) values of lapatinib, neratinib, tucatinib, poziotinib, TAS2940, and osimertinib ( n = 3). (B) Total flux (p/s) values in the NCI‐N87‐luc intracranial model. (C) Bioluminescence images obtained on day 22. (D) Total flux (p/s) values in the NCI‐N87‐luc intracranial model with different dosing schedules of TAS2940. (E) Target inhibition of TAS2940 assessed by phospho‐HER2 and growth fraction assessed by Ki‐67 in the NCI‐N87‐luc model. (F) Antitumor activity and survival benefit of TAS2940 in the NCI‐H1975_EGFR ex20ins SVD‐luc intracranial nude mouse model. Data are presented as the mean ± SE ( n = 8 in B,C; n = 6 in D). EGFR, human epidermal growth factor receptor.
Article Snippet: The kinase assays using the ERBB inhibitors were outsourced to SignalChem Lifesciences Corporation for HER2 mutations or
Techniques: Activity Assay, Concentration Assay, Inhibition
Journal: Wiley interdisciplinary reviews. Nanomedicine and nanobiotechnology
Article Title: Image-guided tumor surgery: The emerging role of nanotechnology
doi: 10.1002/wnan.1624
Figure Lengend Snippet: NPs for intraoperative tumor detection
Article Snippet: NIR-830-Z HER2:342 -IONP-Cisplatin , SPION , SPION + NIR-830 + HER2 Affibody , 18–24 , 800/830 ,
Techniques: Single Photon Emission Computed Tomography, Polymer, In Vivo, Virus, Recombinant, Binding Assay
Journal: Cancers
Article Title: HER-2-Targeted Nanoparticles for Breast Cancer Diagnosis and Treatment
doi: 10.3390/cancers14102424
Figure Lengend Snippet: Strategies for HER-2 + BC therapy ( I ) NPs functionalized with HER-2 targeting ligands ensure a specific targeting into HER-2 + cancer cells; ( II ) NPs can vehicle chemotherapeutic drugs or cytotoxic agents into HER-2 + cancer cells; ( III ) NPs functionalized with photothermal agents can promote local radiation to obtain tumor ablation; ( IV ) NPs can deliver nucleic acids or gene silencing molecules to enable gene expression regulation and overcome the insurgence of resistance to conventional therapies.
Article Snippet: ,
Techniques: Expressing

Journal: Cancers
Article Title: HER-2-Targeted Nanoparticles for Breast Cancer Diagnosis and Treatment
doi: 10.3390/cancers14102424
Figure Lengend Snippet: Summary of all significant examples of organic NPs developed for HER-2 + BC therapy.
Article Snippet: ,
Techniques: Activity Assay, In Vitro, Recombinant, Inhibition, Permeability, In Vivo, Binding Assay, Solubility

Journal: Cancers
Article Title: HER-2-Targeted Nanoparticles for Breast Cancer Diagnosis and Treatment
doi: 10.3390/cancers14102424
Figure Lengend Snippet: Nanotechnology approaches for HER-2 + BC diagnosis.
Article Snippet: ,
Techniques: